アプリ概要
関西2府4県(滋賀県,京都府,大阪府,兵庫県,奈良県,和歌山県)の浸水想定区域と日本全国の避難所約12万6千件を収録した洪水ハザードマップアプリです。現在地または任意地点の想定最大浸水深と同じ行政区域にある浸水しない最近隣の避難所を検索することができます。浸水想定区域および避難所はいずれも平成24年度作成のデータを収録しています。はじめての土地で現地のハザードマップを所持していないときや,災害対応の机上訓練などにご利用ください。
ちなみに,本アプリは開発者が近隣の避難所を検索した際,水没する避難所が指定されている場合や隣接自治体の避難所の方が近かったりしたため,緊急避難によりふさわしい避難所を見つけるため開発したプロトタイプがベースになっています。
使用方法
本アプリは災害時に使用するものではなく,事前の確認,机上訓練での使用を想定しています。緊急時に指定避難所が耐震補強中などの原因で開設されない場合もありますので,別途に近隣の避難所情報を市報などで必ず確認してください。
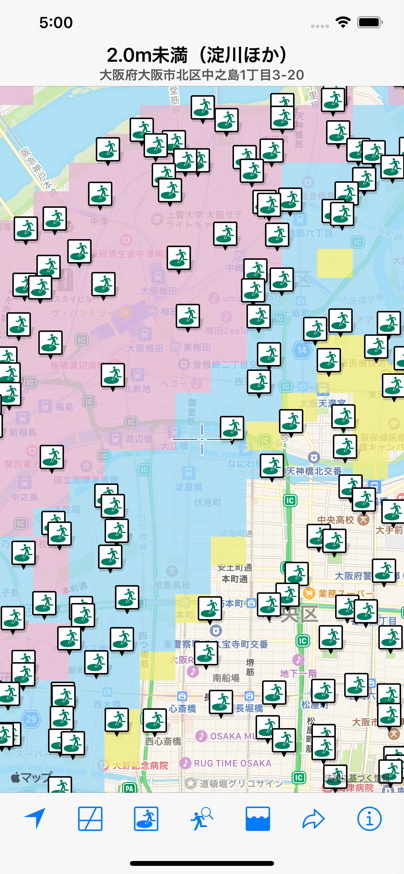
アプリを起動すると地図とともに画面中央にスコープが表示されます。地図を移動するごとに画面中央の想定浸水深と住所が表示されます。浸水想定区域が複数あると,その中から最大の浸水深が計算されて表示されます。ただし,表示する洪水予報・水位周知河川を指定している場合は,指定した河川の想定浸水区域の浸水深が表示されます。画面の避難所アイコンをタップすると避難所名と種別が吹き出し(コールアウト)に表示されます。吹き出し内のアイコンをタップすると,避難所の詳細な情報を確認することができます。
画面下にはツールバーがあり,機能は左から現在地表示,地図切り替え,避難地情報検索,避難所レイヤ表示・非表示,洪水予報・水位周知河川指定,指定自治体に移動,アプリ情報,となっています。避難地情報検索が本アプリのメインの機能になります。
1. 現在地表示
GNSSで取得した位置を画面中央に設定します。
2. 地図切り替え
地図,地図と衛星写真,衛星写真,と順に画面表示が切り替わります。
3. 避難所レイヤ表示・非表示
避難所アイコンの表示と非表示が切り替わります。縮尺が25万分の1より小さくなると自動的に非表示になります。動作が重いと感じるときにレイヤを非表示にすることで,表示速度を改善することができます。
4. 避難地情報検索
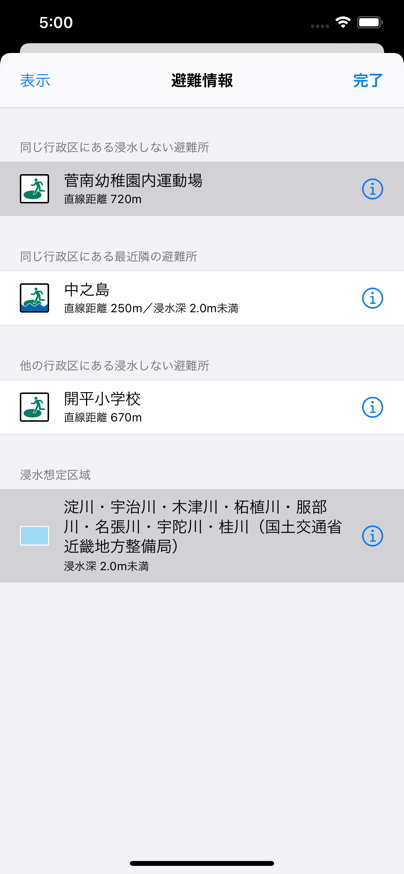
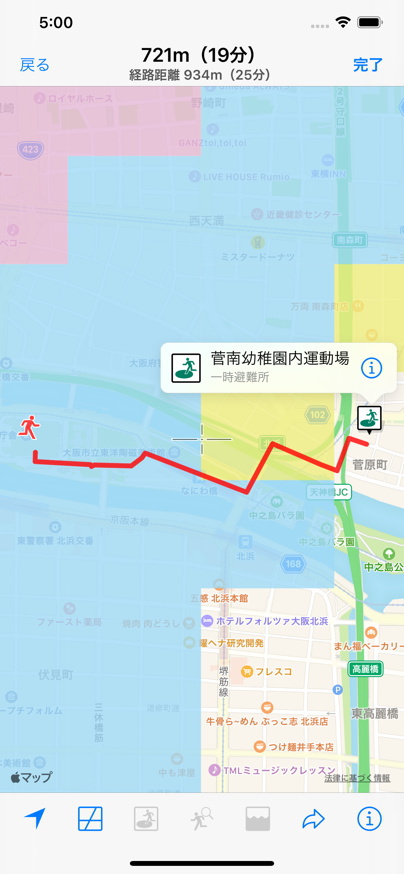
画面中心のスコープの位置から最も近い位置にある避難所と関連する浸水想定区域の一覧を表示します。捜索範囲は10kmです。避難所は1)同一行政界で浸水しない避難所,2)同一行政界にある浸水の恐れがある避難所,3)他の行政界にある浸水しない避難所,4)他の行政界にある浸水の恐れがある避難所,の最大4件が小さい番号順に検索されます。避難情報表示画面で避難所を選択して表示ボタンをタップすると,現在地と避難所がズームアップして表示されます。このとき,通常は直線距離とその避難時間が表示されますが,ネットワーク検索が可能であれば最短経路も表示されます。浸水区域も同時に表示することができます。
5. 洪水予報・水位周知河川指定
マップ画面表示する洪水予報・水位周知河川の想定浸水区域を選択できます。捜索範囲は1kmです。区域選択後に完了ボタンをタップすると,画面に浸水区域が表示されます。
6. 指定自治体に移動
日本全国の地方自治体一覧が表示され,選択することで画面が指定自治体の役所の位置に移動します。都道府県庁の場合,リスト右のアイコンをタップすると各庁舎位置に移動します。役所が管轄する行政区域にない場合,管轄する行政区域内にある最も大きな(人口の多い管轄の)出張所に移動します。
7. アプリ情報
浸水想定区域の凡例,使用上の注意,使用データの出典,免責事項が表示されます。
データ出典
- 国土数値情報 浸水想定区域データ(平成24年度作成,国土交通省)
- 国土数値情報 避難施設データ(平成24年度作成,国土交通省)
備考
- 表示項目の誤字脱字には細心の注意を払っていますが,お気づきの点があればご連絡ください。
- 耐震補強などによる避難所の一時的な変更は反映されていませんのでご注意ください。
- ルート検索機能は路地などが反映されず,検索結果が正しくない可能性がありますのでご了承ください。
- 浸水想定区域データは平成23年度時点のデータになります。
- 本アプリはかなり重い部類に入ります。機種によってはフリーズしたように感じるかもしれませんので,逐次解析をなくしたバージョンも検討中です。
FAQ(よくある質問と回答)
質問:同じ色で表示されているのに場所によって浸水深が違うのはなぜですか?
回答:日本国内の洪水ハザードマップは洪水ハザードマップ作成の手引き(国土交通省河川局治水課,平成17年6月)にしたがって作成されてきました。同手引きでは,浸水深ランクの表示は浸水想定区域図作成マニュアル(国土交通省河川局治水課,平成17年6月)にしたがいます。同マニュアルでは浸水深ランクは5段階表示を基本とし,必要に応じて7段階までの表示を可能とすることが定められました。その後,住民がとるべき避難行動をよりわかりやすくイメージできるよう,平成25年3月に洪水ハザードマップ作成の手引き改定版(国土交通省水管理・国土保全局河川環境課水防企画室,平成25年3月)が公開されました。わかりやすさを重視し,洪水ハザードマップにおける浸水深ランクの表示は新たな3段階または4段階による表示が標準となりました。
本アプリは改定版(平成25年3月版)の内容に合わせているため,地図表示上は上記4段階の表示になっています。アプリ内部的には5段階または7段階のデータを用いていますので,画面中央のカーソルを合わせると5段階または7段階による想定浸水深の値が表示されるようになっています。これらの取り扱いを図にまとめると以下のようになります。
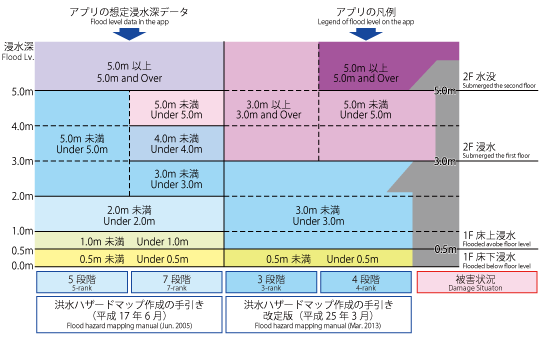
図:浸水深ランクの種類とアプリでの取り扱い
質問:移動時間はどのように計算しているのでしょうか?
回答:国土交通省の「東日本大震災の津波被災現況調査」の結果を基に,避難速度を時速2.3kmとして計算しています。震災は昼間時に発生しましたので,夜間の場合はさらに遅くなる可能性があることに留意してください。また同調査の結果,徒歩による最長の避難距離が10km未満であったことから,本アプリの避難所の検索範囲を最長10kmとしています。
バージョン履歴
| v2.3.4 2021年5月31日 | 最終バージョン |
|---|---|
| v2.3.3 2021年2月23日 | iOS14のサポート データ更新の終了 |
| v2.3.2 2019年11月13日 | iOS13のサポート ダークモードのサポート |
| v2.3.1 2019年9月17日 | iOS 12のサポート iPad Pro(第3世代)のサポート バグの修正 |
| v2.3 2017年11月21日 | iOS 11のサポート iPhone Xのサポート 避難所の所属自治体の改訂(富谷市) |
| v2.2.1 2016年5月3日 | 行政区別避難所検索が無効となるバグの修正 |
| v2.2 2016年4月30日 | iPadとiOS 9のサポート 避難所の所属自治体の改訂(栃木市,滝沢市,大網白里市) |
| v2.1.1 2015年8月7日 | 表示縮尺に関係なく浸水深を表示するよう修正 洪水検索範囲の修正 アイコンの変更 |
| v2.1 2015年2月21日 | iOS 8に対応 iPhone 6およびiPhone 6 Plusに対応 ジオコーディングの仕様変更に対応 |
| v2.0 2014年6月19日 | 任意の浸水区域表示機能の追加 現在地の浸水深表示方法の改良 避難所検索結果表示方法の改良 都市データベースの更新 データベース読み込み方法の改良 同一名称の市(府中市,伊達市)における避難所検索のバグの修正 サポートOSをiOS 6以上に変更 |
| v1.1.1 2014年3月4日 | 避難所検索の範囲の修正 避難所アイコン表示の高速化 |
| v1.1 2014年1月30日 | オーバーレイ解析とアドレスマッチングのタイミングの最適化 |
| v1.0.1 2014年1月23日 | 内包判定のバグの修正 |
| v1.0 2014年1月18日 | 新規リリース |
Outline
This app is a viewer of flood hazard maps in Kansai, Japan which includes Shiga, Kyoto, Osaka, Hyogo, Nara and Wakayama prefecture. The app has all shelter information in Japan and floods in Kansai. Therefore, it can search the nearest shelter and flood level at a current location or an arbitrary one.
How to Use
Please do not use this app without a rehearsal in time of a disaster, because the app was created for a desktop exercise. And be sure to check neighboring shelter information by a newsletter, etc. in your city.
The app shows an address and a flood level at a central location on a screen map. If the location has some floods, the app searches for the maximum flood level in the floods. Tap a shelter icon, it shows a balloon with shelter name and types. If you tap the balloon then, the app shows detailed information about the shelter. There is a toolbar under the screen. The toolbar has seven functions: Show current location, Change map type, Search shelters, Shelter layer switch, Floods layer switch, Move and App information.
1. Show current location
It moves the center of a screen map to a current location.
2. Change map type
It changes a map type in order of a map, a hybrid, and an aerial photograph.
3. Shelter layer switch
It turns on/off shelter icons. If the map scale is less than 1/250000, the icons are hidden automatically.
4. Search shelters
It searches the nearest shelter from a location that is the center of a screen map. And changes to detail check mode. You can check the nearest shelter and related floods in this mode. The finish is to tap the “Done” button.
5. Set target flood
You can choose a displaying flood. If you set the flood, the app shows the flood level of only chosen flood.
6. Move
It shows a local government list in Japan. If you select the government, the center of the screen map moves to a location of the selected government office.
7. App Information
It is displayed a legend, notices, data sources and exemption from liability.
Data Sources
- National Land Numerical Information, Flood Zones (2012, MLIT Japan)
- National Land Numerical Information, Shelters (2012, MLIT Japan)
Notes
- If you have found any English mistakes please let us know.
- The app doesn’t provide updated information in the case of shelters being retrofitted or relocated.
- The shortest route given may not always be accurate.
- Flood zone data is accurate as of 2012.
- Proper nouns are displayed in Japanese only.
FAQ
Q: Why does a value of floodwater depth change with places although a legend color is the same?
A: The floodwater depth is displayed in four-rank but the depth data divided into five or seven classifications. Therefore, the app shows the depth with a five-rank or a seven-rank. The ranks of floodwater depth are shown in the figure below.

Fig.: Handling the ranks of flood water depth in the app
Q: How much is the refuge speed?
A: The refuge speed is being used 2.3km/h from an investigation of MLIT Japan.
Version History
| v2.3.4 May 31, 2021 | The final version |
|---|---|
| v2.3.3 Feb. 23, 2021 | Supported iOS 14. |
| v2.3.2 Nov. 13, 2019 | Supported iOS 13. Supported Dark Mode. |
| v2.3.1 Sept. 17, 2019 | Supported iOS 12. Supported iPad Pro 3rd Generation. Fixed bugs. |
| v2.3 Nov. 21, 2017 | Support for iOS 11. Support for iPhone X. Revised shelters information. |
| v2.2.1 May 3, 2016 | Fixed a bug. |
| v2.2 Apr. 30, 2016 | Supported iPad and iOS 9. Revised shelters information. |
| v2.1.1 Aug. 7, 2015 | Improved operability. Changed app icon. |
| v2.1 Feb. 21, 2015 | Supported iOS 8. Supported iPhone 6 and iPhone 6 Plus. Fixed displaying an address in Japanese. |
| v2.0 June 19, 2014 | Added a function which displays optional flood area. Improved a displaying method of flood depth level on a current position. Improved a displaying method of search results of shelters. Updated a city database. Improved a method which read a database. Required iOS 6 and over. |
| v1.1.1 Mar. 4, 2014 | Fixed a range of finding shelters. Improved displaying shelters. |
| v1.1 Jan. 30, 2014 | Optimized timing between the address matching and the overlay analysis. |
| v1.0.1 Jan. 23, 2014 | Fixed a bug that a geometry test sometimes fails. |
| v1.0 Jan. 18, 2014 | New release |


